| |||||||||||||||||||||||||||||||||||||||||||||||||||||||||||||||||||||||||||||
20 seats to Epping Forest District Council 29 seats needed for a majority | |||||||||||||||||||||||||||||||||||||||||||||||||||||||||||||||||||||||||||||
|---|---|---|---|---|---|---|---|---|---|---|---|---|---|---|---|---|---|---|---|---|---|---|---|---|---|---|---|---|---|---|---|---|---|---|---|---|---|---|---|---|---|---|---|---|---|---|---|---|---|---|---|---|---|---|---|---|---|---|---|---|---|---|---|---|---|---|---|---|---|---|---|---|---|---|---|---|---|
| Turnout | 29.0% | ||||||||||||||||||||||||||||||||||||||||||||||||||||||||||||||||||||||||||||
| |||||||||||||||||||||||||||||||||||||||||||||||||||||||||||||||||||||||||||||
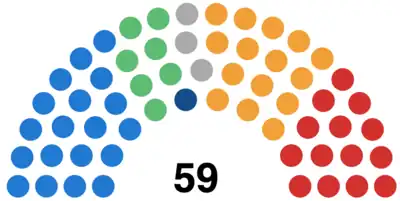 Council composition following the election | |||||||||||||||||||||||||||||||||||||||||||||||||||||||||||||||||||||||||||||
| |||||||||||||||||||||||||||||||||||||||||||||||||||||||||||||||||||||||||||||
Elections to Epping Forest Council were held on 6 May 1999. One third of the council was up for election and the council stayed under no overall control. Overall turnout was 29%. This was the last time the Epping Residents Association had representation on the district council.
By-elections
Sheering by-election
Councillor Yeo who previously represented Sheering died in early 1999 prompting a by-election which was subsequently won by the Conservatives' John Harrington who completed Yeo's term until being elected to a full term in 2000.
| Party | Candidate | Votes | % | ±% | |
|---|---|---|---|---|---|
| Conservative | John Harrington | 371 | 50.9 | ||
| Liberal Democrats | 276 | 37.9 | |||
| Labour | 82 | 11.2 | |||
| Majority | 95 | 13.0 | |||
| Turnout | 729 | 32.9 | |||
| Conservative gain from Liberal Democrats | Swing | ||||
Results
Broadway
| Party | Candidate | Votes | % | ±% | |
|---|---|---|---|---|---|
| Labour | Joan Davis | 703 | 77.6 | ||
| Conservative | Lorne Daniel | 203 | 22.4 | ||
| Majority | 500 | 55.2 | |||
| Turnout | 906 | 22.3 | |||
| Labour hold | Swing | ||||
Buckhurst Hill East
| Party | Candidate | Votes | % | ±% | |
|---|---|---|---|---|---|
| Liberal Democrats | Malcolm Woollard | 580 | 64.8 | ||
| Conservative | George Denny | 207 | 23.1 | ||
| Labour | Lynn Baddock | 108 | 12.1 | ||
| Majority | 373 | 41.7 | |||
| Turnout | 895 | 26.1 | |||
| Liberal Democrats hold | Swing | ||||
Buckhurst Hill West
| Party | Candidate | Votes | % | ±% | |
|---|---|---|---|---|---|
| Liberal Democrats | Michael Heavens | 889 | 53.0 | ||
| Conservative | Richard Watts | 713 | 42.5 | ||
| Labour | Janice Croke | 74 | 4.4 | ||
| Majority | 176 | 10.5 | |||
| Turnout | 1,676 | 32.7 | |||
| Liberal Democrats hold | Swing | ||||
Chipping Ongar
| Party | Candidate | Votes | % | ±% | |
|---|---|---|---|---|---|
| Liberal Democrats | Keith Wright | 290 | 50.0 | ||
| Conservative | Frank Love | 212 | 36.6 | ||
| Labour | Sheila Spring | 78 | 13.4 | ||
| Majority | 78 | 13.4 | |||
| Turnout | 580 | 44.3 | |||
| Liberal Democrats hold | Swing | ||||
Debden Green
| Party | Candidate | Votes | % | ±% | |
|---|---|---|---|---|---|
| Labour | Gillian Huckle | 635 | 75.5 | ||
| Conservative | Derek Knight | 206 | 24.5 | ||
| Majority | 429 | 51.0 | |||
| Turnout | 841 | 21.1 | |||
| Labour hold | Swing | ||||
Epping Hemnall
| Party | Candidate | Votes | % | ±% | |
|---|---|---|---|---|---|
| Liberal Democrats | Jonathan Whitehouse | 968 | 50.1 | ||
| Conservative | Diana Collins | 784 | 40.6 | ||
| Labour | Vivien Cave | 181 | 9.4 | ||
| Majority | 184 | 9.5 | |||
| Turnout | 1,933 | 40.7 | |||
| Liberal Democrats gain from Conservative | Swing | ||||
Epping Lindsey
| Party | Candidate | Votes | % | ±% | |
|---|---|---|---|---|---|
| Conservative | Penny Smith | 704 | 49.4 | ||
| Labour | Barry Johns | 435 | 30.5 | ||
| Liberal Democrats | Joanne Whitehouse | 287 | 20.1 | ||
| Majority | 269 | 18.9 | |||
| Turnout | 1,426 | 30.2 | |||
| Conservative gain from Epping Residents Association | Swing | ||||
Grange Hill
| Party | Candidate | Votes | % | ±% | |
|---|---|---|---|---|---|
| Liberal Democrats | Peter Spencer | 638 | 54.9 | ||
| Conservative | Hilary Wood | 422 | 36.3 | ||
| Labour | Ronald Rodwell | 102 | 8.8 | ||
| Majority | 216 | 18.6 | |||
| Turnout | 1,162 | 26.0 | |||
| Liberal Democrats hold | Swing | ||||
Greensted and Marden Ash
| Party | Candidate | Votes | % | ±% | |
|---|---|---|---|---|---|
| Liberal Democrats | Derek Jacobs | 393 | 53.8 | ||
| Conservative | Nicola Deller | 172 | 23.5 | ||
| Labour | Robert MacDonald | 166 | 22.7 | ||
| Majority | 221 | 30.3 | |||
| Turnout | 731 | 39.8 | |||
| Liberal Democrats hold | Swing | ||||
High Beech
| Party | Candidate | Votes | % | ±% | |
|---|---|---|---|---|---|
| Conservative | Norma Green | 578 | 78.6 | ||
| Labour | Sidney Miller | 102 | 13.9 | ||
| Liberal Democrats | Lucille Thompson | 55 | 7.5 | ||
| Majority | 476 | 64.7 | |||
| Turnout | 735 | 34.2 | |||
| Conservative hold | Swing | ||||
Lambourne
| Party | Candidate | Votes | % | ±% | |
|---|---|---|---|---|---|
| Liberal Democrats | Kenneth Easlea | 357 | 54.0 | ||
| Conservative | Stephen Metcalfe | 304 | 46.0 | ||
| Majority | 53 | 8.0 | |||
| Turnout | 661 | 37.8 | |||
| Liberal Democrats hold | Swing | ||||
Loughton Roding
| Party | Candidate | Votes | % | ±% | |
|---|---|---|---|---|---|
| Labour | Maureen Boatman | 629 | 61.2 | ||
| Conservative | Norma Pearce | 300 | 29.2 | ||
| Liberal Democrats | Peter Netherclift | 99 | 9.6 | ||
| Majority | 329 | 32.0 | |||
| Turnout | 1,028 | 24.6 | |||
| Labour hold | Swing | ||||
Loughton St. John's
| Party | Candidate | Votes | % | ±% | |
|---|---|---|---|---|---|
| Loughton Residents | Brian Moore | 503 | 53.6 | ||
| Conservative | Ian Locks | 309 | 32.9 | ||
| Labour | Thomas Owen | 126 | 13.4 | ||
| Majority | 194 | 20.7 | |||
| Turnout | 938 | 22.5 | |||
| Loughton Residents hold | Swing | ||||
Moreton and Matching
| Party | Candidate | Votes | % | ±% | |
|---|---|---|---|---|---|
| Independent | Richard Morgan | Unopposed | |||
| Majority | N/A | 100% | |||
| Turnout | N/A | N/A | N/A | ||
| Independent hold | Swing | ||||
Nazeing
| Party | Candidate | Votes | % | ±% | |
|---|---|---|---|---|---|
| Independent | John Carr | 607 | 70.3 | N/A | |
| Conservative | Michael Alldis | 256 | 29.7 | ||
| Majority | 351 | 40.6 | |||
| Turnout | 863 | 23.5 | |||
| Independent hold | Swing | ||||
North Weald Bassett
| Party | Candidate | Votes | % | ±% | |
|---|---|---|---|---|---|
| Conservative | Dave Stallan | 816 | 65.5 | ||
| Labour | Derek Clark | 337 | 27.0 | ||
| Liberal Democrats | Monica Richardson | 93 | 7.5 | ||
| Majority | 479 | 38.5 | |||
| Turnout | 1,246 | 27.7 | |||
| Conservative hold | Swing | ||||
Shelley
| Party | Candidate | Votes | % | ±% | |
|---|---|---|---|---|---|
| Labour | Ronald Barnes | 261 | 79.6 | ||
| Conservative | Jeremy Dean | 67 | 20.4 | ||
| Majority | 194 | 59.2 | |||
| Turnout | 328 | 23.8 | |||
| Labour hold | Swing | ||||
Waltham Abbey East
| Party | Candidate | Votes | % | ±% | |
|---|---|---|---|---|---|
| Conservative | Michael Dickins | 791 | 60.8 | ||
| Labour | Stanley Riley | 405 | 31.1 | ||
| Liberal Democrats | Ingrid Black | 106 | 8.1 | ||
| Majority | 386 | 29.7 | |||
| Turnout | 1,302 | 22.8 | |||
| Conservative gain from Labour | Swing | ||||
Waltham Abbey Paternoster
| Party | Candidate | Votes | % | ±% | |
|---|---|---|---|---|---|
| Conservative | Reginald Chidley | 561 | 63.5 | ||
| Labour | Fitzherbert Harewood | 283 | 32.0 | ||
| Liberal Democrats | Olive Dunseath | 40 | 4.5 | ||
| Majority | 278 | 31.5 | |||
| Turnout | 884 | 25.9 | |||
| Conservative gain from Labour | Swing | ||||
Waltham Abbey West
| Party | Candidate | Votes | % | ±% | |
|---|---|---|---|---|---|
| Conservative | Harold Taylor | 515 | 50.2 | ||
| Labour | John Langer | 435 | 42.4 | ||
| Liberal Democrats | Susan Hutchings | 76 | 7.4 | ||
| Majority | 80 | 7.8 | |||
| Turnout | 1,026 | 24.9 | |||
| Conservative gain from Labour | Swing | ||||
References
This article is issued from Wikipedia. The text is licensed under Creative Commons - Attribution - Sharealike. Additional terms may apply for the media files.