| |||||||||||||||||||||||||||||||||||||||||||||||||
22 of 66 seats (One Third) to Wirral Metropolitan Borough Council 34 seats needed for a majority | |||||||||||||||||||||||||||||||||||||||||||||||||
|---|---|---|---|---|---|---|---|---|---|---|---|---|---|---|---|---|---|---|---|---|---|---|---|---|---|---|---|---|---|---|---|---|---|---|---|---|---|---|---|---|---|---|---|---|---|---|---|---|---|
| Turnout | 27.8% ( | ||||||||||||||||||||||||||||||||||||||||||||||||
| |||||||||||||||||||||||||||||||||||||||||||||||||
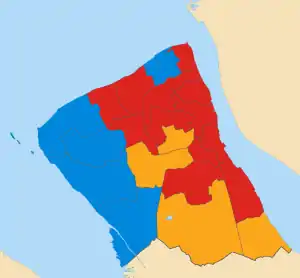 Map of results of 1999 election | |||||||||||||||||||||||||||||||||||||||||||||||||
| |||||||||||||||||||||||||||||||||||||||||||||||||
The 1999 Wirral Metropolitan Borough Council election took place on 6 May 1999 to elect members of Wirral Metropolitan Borough Council in England.[2] This election was held on the same day as other local elections.
After the election, the composition of the council was:
| Party | Seats | ± | |
|---|---|---|---|
| Labour | 39 | ||
| Conservative | 17 | ||
| Liberal Democrats | 10 | ||
Election results
Overall election result
Overall result compared with 1998.
| Wirral Metropolitan Borough Council election results, 1999 | |||||||||||||||
|---|---|---|---|---|---|---|---|---|---|---|---|---|---|---|---|
| Party | Candidates | Votes | |||||||||||||
| Stood | Elected | Gained | Unseated | Net | % of total | % | No. | Net % | |||||||
| Labour | 22 | 13 | 0 | 3 | 59.1 | 38.4 | 26,142 | ||||||||
| Conservative | 22 | 5 | 1 | 0 | 22.7 | 34.8 | 23,675 | ||||||||
| Liberal Democrats | 22 | 4 | 2 | 0 | 18.2 | 23.9 | 16,295 | ||||||||
| Green | 18 | 0 | 0 | 0 | 0.0 | 2.7 | 1,834 | ||||||||
| Socialist Labour | 1 | 0 | 0 | 0 | 0.0 | 0.1 | 94 | ||||||||
Ward results
Bebington
| Party | Candidate | Votes | % | ±% | |
|---|---|---|---|---|---|
| Labour | Patrick Smith | 1,846 | 47.8 | ||
| Conservative | Jacqueline Hall | 1,511 | 39.2 | ||
| Liberal Democrats | Nigel Dyer | 402 | 10.4 | ||
| Green | Ann Jones | 99 | 2.6 | ||
| Majority | 335 | 8.7 | |||
| Registered electors | 10,736 | ||||
| Turnout | 35.9 | ||||
| Labour hold | Swing | ||||
Bidston
| Party | Candidate | Votes | % | ±% | |
|---|---|---|---|---|---|
| Labour | Harry Smith | 1,049 | 81.5 | ||
| Conservative | Doreen Pike | 105 | 8.2 | New | |
| Liberal Democrats | John Tomlinson | 95 | 7.4 | ||
| Green | Robert Mitchell | 38 | 3.0 | ||
| Majority | 944 | 73.3 | |||
| Registered electors | 7,967 | ||||
| Turnout | 16.1 | ||||
| Labour hold | Swing | ||||
Birkenhead
| Party | Candidate | Votes | % | ±% | |
|---|---|---|---|---|---|
| Labour | Phillip Davies | 1,298 | 74.1 | ||
| Liberal Democrats | Mary Williams | 166 | 9.5 | ||
| Conservative | Susan Bebell | 132 | 7.5 | New | |
| Socialist Labour | Alec McFadden | 94 | 5.4 | New | |
| Green | Stuart Harvey | 62 | 3.5 | New | |
| Majority | 1,132 | 64.6 | |||
| Registered electors | 9,887 | ||||
| Turnout | 17.7 | ||||
| Labour hold | Swing | ||||
Bromborough
| Party | Candidate | Votes | % | ±% | |
|---|---|---|---|---|---|
| Labour | Anna McLaughlin | 1,504 | 54.8 | ||
| Liberal Democrats | Robert Moon | 578 | 21.0 | ||
| Conservative | Ian Mackenzie | 565 | 20.6 | ||
| Green | J. Jones | 99 | 3.6 | ||
| Majority | 926 | 33.7 | |||
| Registered electors | 10,720 | ||||
| Turnout | 25.6 | ||||
| Labour hold | Swing | ||||
Clatterbridge
| Party | Candidate | Votes | % | ±% | |
|---|---|---|---|---|---|
| Liberal Democrats | Isabel Moon | 2,011 | 38.1 | ||
| Conservative | Mary Jordan | 1,735 | 32.9 | ||
| Labour | Audrey Moore | 1,417 | 26.8 | ||
| Green | Michael Harper | 116 | 2.2 | ||
| Majority | 276 | 5.2 | N/A | ||
| Registered electors | 13,936 | ||||
| Turnout | 37.9 | ||||
| Liberal Democrats gain from Labour | Swing | ||||
Claughton
| Party | Candidate | Votes | % | ±% | |
|---|---|---|---|---|---|
| Labour | Denise Roberts | 1,406 | 54.1 | ||
| Liberal Democrats | Stephen Blaycock | 527 | 20.3 | ||
| Conservative | Barbara Brassey | 512 | 19.7 | ||
| Green | Elisabeth Heydon | 153 | 5.9 | ||
| Majority | 879 | 33.8 | |||
| Registered electors | 10,725 | ||||
| Turnout | 24.2 | ||||
| Labour hold | Swing | ||||
Eastham
| Party | Candidate | Votes | % | ±% | |
|---|---|---|---|---|---|
| Liberal Democrats | George Mitchell | 2,278 | 64.0 | ||
| Labour | S. Blair | 796 | 22.4 | ||
| Conservative | S. Hutchen | 422 | 11.9 | ||
| Green | Brian Gibbs | 63 | 1.8 | ||
| Majority | 1,482 | 41.6 | |||
| Registered electors | 11,171 | ||||
| Turnout | 31.9 | ||||
| Liberal Democrats hold | Swing | ||||
Egerton
| Party | Candidate | Votes | % | ±% | |
|---|---|---|---|---|---|
| Labour | Walter Smith | 1,441 | 65.1 | ||
| Conservative | Cyrus Ferguson | 368 | 16.6 | ||
| Liberal Democrats | Philip Lloyd | 234 | 10.6 | ||
| Green | Catherine Page | 172 | 7.8 | ||
| Majority | 1,073 | 48.4 | |||
| Registered electors | 10,468 | ||||
| Turnout | 21.2 | ||||
| Labour hold | Swing | ||||
Heswall
| Party | Candidate | Votes | % | ±% | |
|---|---|---|---|---|---|
| Conservative | Peter Johnson | 2,894 | 67.9 | ||
| Labour | Margaret Allen | 740 | 17.4 | ||
| Liberal Democrats | Jean Norton | 508 | 11.9 | ||
| Green | Garnette Bowler | 118 | 2.8 | ||
| Majority | 2,154 | 50.6 | |||
| Registered electors | 13,325 | ||||
| Turnout | 32.0 | ||||
| Conservative hold | Swing | ||||
Hoylake
| Party | Candidate | Votes | % | ±% | |
|---|---|---|---|---|---|
| Conservative | John Hale | 2,820 | 67.2 | ||
| Labour | Dennis Woods | 782 | 18.6 | ||
| Liberal Democrats | Alan Richards | 446 | 10.6 | ||
| Green | Allen Burton | 149 | 3.6 | ||
| Majority | 2,038 | 48.6 | |||
| Registered electors | 12,447 | ||||
| Turnout | 33.7 | ||||
| Conservative hold | Swing | ||||
Leasowe
| Party | Candidate | Votes | % | ±% | |
|---|---|---|---|---|---|
| Labour | Ernest Prout | 1,330 | 71.4 | ||
| Conservative | J. Tooke | 293 | 15.7 | ||
| Liberal Democrats | M. Wright | 239 | 12.8 | ||
| Majority | 1,037 | 55.7 | |||
| Registered electors | 9,187 | ||||
| Turnout | 20.3 | ||||
| Labour hold | Swing | ||||
Liscard
| Party | Candidate | Votes | % | ±% | |
|---|---|---|---|---|---|
| Labour | John Cocker | 1,343 | 56.1 | ||
| Conservative | Patricia Jones | 666 | 27.8 | ||
| Liberal Democrats | James Robinson | 387 | 16.2 | ||
| Majority | 677 | 28.3 | |||
| Registered electors | 11,010 | ||||
| Turnout | 21.8 | ||||
| Labour hold | Swing | ||||
Moreton
| Party | Candidate | Votes | % | ±% | |
|---|---|---|---|---|---|
| Labour | Margaret Green | 1,266 | 46.4 | ||
| Conservative | Simon Mountney | 1,222 | 44.8 | ||
| Liberal Democrats | Susanne Uriel | 239 | 8.8 | ||
| Majority | 44 | 1.6 | |||
| Registered electors | 9,737 | ||||
| Turnout | 28.0 | ||||
| Labour hold | Swing | ||||
New Brighton
| Party | Candidate | Votes | % | ±% | |
|---|---|---|---|---|---|
| Labour | Therese Irving | 1,348 | 44.7 | ||
| Conservative | Anthony Pritchard | 1,286 | 42.6 | ||
| Liberal Democrats | John Codling | 281 | 9.3 | ||
| Green | George Bowler | 102 | 3.4 | ||
| Majority | 62 | 2.1 | |||
| Registered electors | 11,468 | ||||
| Turnout | 26.3 | ||||
| Labour hold | Swing | ||||
Oxton
| Party | Candidate | Votes | % | ±% | |
|---|---|---|---|---|---|
| Liberal Democrats | Patricia Williams | 2,103 | 66.0 | ||
| Labour | John Salter | 606 | 19.0 | ||
| Conservative | Leonard Moore | 380 | 11.9 | ||
| Green | Pamela Mitchell | 98 | 3.1 | ||
| Majority | 1,497 | 47.0 | |||
| Registered electors | 11,365 | ||||
| Turnout | 28.0 | ||||
| Liberal Democrats hold | Swing | ||||
Prenton
| Party | Candidate | Votes | % | ±% | |
|---|---|---|---|---|---|
| Liberal Democrats | Simon Holbrook | 2,071 | 54.3 | ||
| Labour | C. Riley | 918 | 24.1 | ||
| Conservative | David Elderton | 752 | 19.7 | ||
| Green | John Wilson | 76 | 2.0 | ||
| Majority | 1,153 | 30.2 | |||
| Registered electors | 11,460 | ||||
| Turnout | 33.3 | ||||
| Liberal Democrats gain from Labour | Swing | ||||
Royden
| Party | Candidate | Votes | % | ±% | |
|---|---|---|---|---|---|
| Conservative | Geoffrey Watt | 1,887 | 40.7 | ||
| Liberal Democrats | Peter Reisdorf | 1,867 | 40.2 | ||
| Labour | G. O'Neil | 798 | 17.2 | ||
| Green | Barbara Burton | 88 | 1.9 | ||
| Majority | 20 | 0.4 | |||
| Registered electors | 12,694 | ||||
| Turnout | 36.5 | ||||
| Conservative hold | Swing | ||||
Seacombe
| Party | Candidate | Votes | % | ±% | |
|---|---|---|---|---|---|
| Labour | Adrian Jones | 1,349 | 63.6 | ||
| Liberal Democrats | K. Robinson | 552 | 26.0 | ||
| Conservative | K. Hobson | 220 | 10.4 | ||
| Majority | 797 | 37.6 | |||
| Registered electors | 10,745 | ||||
| Turnout | 19.7 | ||||
| Labour hold | Swing | ||||
Thurstaston
| Party | Candidate | Votes | % | ±% | |
|---|---|---|---|---|---|
| Conservative | Jeffrey Green | 2,333 | 58.7 | ||
| Labour | A. Terry | 1,129 | 28.4 | ||
| Liberal Democrats | Charles Wall | 404 | 10.2 | ||
| Green | Percy Hogg | 108 | 2.7 | ||
| Majority | 1,204 | 30.3 | |||
| Registered electors | 12,445 | ||||
| Turnout | 31.9 | ||||
| Conservative hold | Swing | ||||
Tranmere
| Party | Candidate | Votes | % | ±% | |
|---|---|---|---|---|---|
| Labour | Christine Meaden | 1,150 | 75.7 | ||
| Liberal Democrats | Christopher Teggin | 153 | 10.1 | ||
| Conservative | Yvonne Sanne | 126 | 8.3 | New | |
| Green | Angela Upton | 91 | 6.0 | ||
| Majority | 997 | 65.6 | |||
| Registered electors | 9,068 | ||||
| Turnout | 16.8 | ||||
| Labour hold | Swing | ||||
Upton
| Party | Candidate | Votes | % | ±% | |
|---|---|---|---|---|---|
| Labour | Peter Corcoran | 1,710 | 55.2 | ||
| Conservative | D. Milligan | 904 | 29.2 | ||
| Liberal Democrats | Michael Redfern | 392 | 12.6 | ||
| Green | Joyce Hogg | 94 | 3.0 | ||
| Majority | 806 | 26.0 | |||
| Registered electors | 12,310 | ||||
| Turnout | 25.2 | ||||
| Labour hold | Swing | ||||
Wallasey
| Party | Candidate | Votes | % | ±% | |
|---|---|---|---|---|---|
| Conservative | Ian Lewis | 2,542 | 64.7 | ||
| Labour | M. Keenan [n 1] | 916 | 23.3 | ||
| Liberal Democrats | John Uriel | 362 | 9.2 | ||
| Green | F. Gillespie | 108 | 2.7 | ||
| Majority | 1,626 | 41.4 | |||
| Registered electors | 11,813 | ||||
| Turnout | 33.3 | ||||
| Conservative gain from Labour | Swing | ||||
Notes
• italics denote the sitting councillor • bold denotes the winning candidate
- ↑ Incumbent councillor for New Brighton ward.
References
- 1 2 "Local Election Summaries 1999". The Elections Centre. Retrieved 26 December 2018.
- 1 2 3 4 5 6 7 8 9 10 11 12 13 14 15 16 17 18 19 20 21 22 23 24 "Metropolitan Borough of Wirral Election Results 1973-2012 (Pg. 15)" (PDF). The Elections Centre. Retrieved 26 December 2018.
- ↑ "Council compositions". The Elections Centre. Retrieved 27 July 2018.
- ↑ "Councillor Tony Smith". Wirral Metropolitan Borough Council.
- ↑ "Councillor Harry Smith". Wirral Metropolitan Borough Council.
- ↑ "Councillor Phil Davies". Wirral Metropolitan Borough Council. Archived from the original on 12 June 2018. Retrieved 30 December 2018.
- ↑ "Councillor Bob Moon". Wirral Metropolitan Borough Council.
- ↑ "Councillor Mary Jordan". Wirral Metropolitan Borough Council. 31 July 2023.
- ↑ "Councillor Denise Roberts". Wirral Metropolitan Borough Council.
- ↑ "Councillor Dave Mitchell". Wirral Metropolitan Borough Council.
- ↑ "Councillor Walter Smith". Wirral Metropolitan Borough Council. Archived from the original on 12 June 2018. Retrieved 30 December 2018.
- ↑ "Councillor Peter Johnson". Wirral Metropolitan Borough Council. Archived from the original on 5 July 2018. Retrieved 30 December 2018.
- ↑ "Councillor John Hale". Wirral Metropolitan Borough Council. Archived from the original on 5 July 2018. Retrieved 30 December 2018.
- ↑ "Councillor Simon R Mountney". Wirral Metropolitan Borough Council. 31 July 2023.
- ↑ "Councillor Tony Pritchard". Wirral Metropolitan Borough Council.
- ↑ "Councillor Pat Williams". Wirral Metropolitan Borough Council. Archived from the original on 12 June 2018. Retrieved 30 December 2018.
- ↑ "Councillor John Salter". Wirral Metropolitan Borough Council.
- ↑ "Councillor Simon Holbrook". Wirral Metropolitan Borough Council. Archived from the original on 12 June 2018. Retrieved 30 December 2018.
- ↑ "Councillor David M Elderton". Wirral Metropolitan Borough Council.
- ↑ "Councillor Geoffrey Watt". Wirral Metropolitan Borough Council.
- ↑ "Councillor Peter Reisdorf". Wirral Metropolitan Borough Council.
- ↑ "Councillor Adrian Jones". Wirral Metropolitan Borough Council.
- ↑ "Councillor Jeff Green". Wirral Metropolitan Borough Council. 31 July 2023.
- ↑ "Councillor Chris Meaden". Wirral Metropolitan Borough Council.
- ↑ "Councillor Ian Lewis". Wirral Metropolitan Borough Council. 31 July 2023.
"Last local elections of this Millennium, so . . . CAST YOUR VOTE". Wirral Globe. 5 May 1999. Retrieved 30 December 2018.
This article is issued from Wikipedia. The text is licensed under Creative Commons - Attribution - Sharealike. Additional terms may apply for the media files.