| Connecticut's 2nd congressional district | |||
|---|---|---|---|
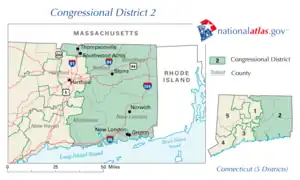
Interactive map of district boundaries since January 3, 2023 | |||
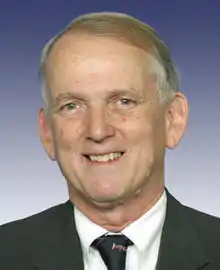
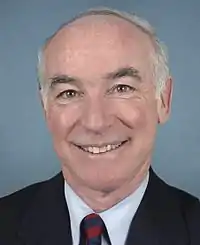
| Representative |
| ||
| Area | 2,143 sq mi (5,550 km2) | ||
| Distribution |
| ||
| Population (2022) | 727,411 | ||
| Median household income | $88,894[1] | ||
| Ethnicity |
| ||
| Cook PVI | D+3[2] | ||
.svg.png.webp)
Connecticut's 2nd congressional district is a congressional district in the U.S. state of Connecticut. Located in the eastern part of the state, the district includes all of New London County, Tolland County, and Windham County, along with parts of Hartford, Middlesex, and New Haven counties. Principal cities include Enfield, Norwich, New London, and Groton.
The district is currently represented by Democrat Joe Courtney. With a Cook Partisan Voting Index rating of D+3, it is one of the least Democratic districts in Connecticut, a state with an all-Democratic congressional delegation.[2]
Towns in the district
The district includes the following towns:
- Hartford County – Enfield, Glastonbury (part), Marlborough, and Suffield.
- Middlesex County – Chester, Clinton, Deep River, East Haddam, East Hampton, Essex, Haddam, Killingworth, Old Saybrook, and Westbrook.
- New Haven County – Madison.
- New London County – Bozrah, Colchester, East Lyme, Franklin, Griswold, Groton, Lebanon, Ledyard, Lisbon, Lyme, Montville, New London, North Stonington, Norwich, Old Lyme, Preston, Salem, Sprague, Stonington, Voluntown, and Waterford.
- Tolland County – Andover, Bolton, Columbia, Coventry, Ellington, Hebron, Mansfield, Somers, Stafford, Tolland, Union, Vernon, and Willington.
- Windham County – Ashford, Brooklyn, Canterbury, Chaplin, Eastford, Hampton, Killingly, Plainfield, Pomfret, Putnam, Scotland, Sterling, Thompson, Windham, and Woodstock.
Voter registration
| Voter registration and party enrollment as of October 31, 2023[3] | |||||
|---|---|---|---|---|---|
| Party | Active | Inactive | Total | Percentage | |
| Democratic | 144,072 | 13,769 | 157,841 | 29.85% | |
| Republican | 115,845 | 9,243 | 125,088 | 23.66% | |
| Minor Parties | 8,840 | 948 | 9,788 | 1.85% | |
| Unaffiliated | 211,538 | 24,486 | 236,024 | 44.64% | |
| Total | 480,295 | 48,446 | 528,741 | 100% | |
Recent statewide election results
| Election results from statewide races | ||
|---|---|---|
| Year | Office | Results |
| 2000 | President | Gore 55–38% |
| 2004 | President | Kerry 54–44% |
| 2008 | President | Obama 58–40% |
| 2012 | President | Obama 56–43% |
| 2016 | President | Clinton 49–46% |
| Senate | Blumenthal 61–36% | |
| 2018 | Senate | Murphy 56–42% |
| Governor | Stefanowski 49–45% | |
| 2020 | President | Biden 55–44% |
| 2022 | Senate | Blumenthal 55–45% |
Recent elections
1992
| Party | Candidate | Votes | % | ±% | |
|---|---|---|---|---|---|
| Democratic | Samuel Gejdenson (incumbent) | 123,291 | 51% | ||
| Republican | Edward W. Munster | 119,416 | 49% | ||
| Democratic hold | Swing | ||||
| Turnout | 242,707 | 100% | |||
1994
| Party | Candidate | Votes | % | ±% | |
|---|---|---|---|---|---|
| Democratic | Samuel Gejdenson (incumbent) | 79,188 | 43% | ||
| Republican | Edward W. Munster | 79,167 | 43% | ||
| A Connecticut Party (1990) | David Bingham | 27,716 | 14% | ||
| Democratic hold | Swing | ||||
| Turnout | 186,071 | 100% | |||
1996
| Party | Candidate | Votes | % | ±% | |
|---|---|---|---|---|---|
| Democratic | Samuel Gejdenson (incumbent) | 115,175 | 52% | ||
| Republican | Edward W. Munster | 100,332 | 45% | ||
| Independence Party of America | Dianne G. Ondusko | 6,477 | 3% | ||
| Natural Law | Thomas E. Hall | 1,263 | 0.4% | ||
| Democratic hold | Swing | ||||
| Turnout | 223,258 | 100% | |||
1998
| Party | Candidate | Votes | % | ±% | |
|---|---|---|---|---|---|
| Democratic | Samuel Gejdenson (inc.) | 99,567 | 61% | ||
| Republican | Gary M. Koval | 57,860 | 35% | ||
| Independence Party of America | Dianne G. Ondusko | 5,116 | 3% | ||
| Term Limits | Paul W. Cook | 658 | 0.4% | ||
| Democratic hold | Swing | ||||
| Turnout | 163,201 | 100% | |||
2000
| Party | Candidate | Votes | % | ±% | |
|---|---|---|---|---|---|
| Republican | Rob Simmons | 114,380 | 51% | ||
| Democratic | Samuel Gejdenson (incumbent) | 111,520 | 49% | ||
| Republican gain from Democratic | Swing | ||||
| Turnout | 225,900 | 100% | |||
2002
| Party | Candidate | Votes | % | ±% | |
|---|---|---|---|---|---|
| Republican | Rob Simmons (incumbent) | 117,434 | 54% | ||
| Democratic | Joe Courtney | 99,674 | 46% | ||
| Republican hold | Swing | ||||
| Turnout | 217,108 | 100% | |||
2004
| Party | Candidate | Votes | % | ±% | |
|---|---|---|---|---|---|
| Republican | Rob Simmons (inc.) | 165,558 | 54% | ||
| Democratic | James Sullivan | 139,987 | 46% | - | |
| Republican hold | Swing | ||||
| Turnout | 305,545 | 100% | |||
2006
| Party | Candidate | Votes | % | ±% | |
|---|---|---|---|---|---|
| Democratic | Joe Courtney | 121,248 | 50% | ||
| Republican | Rob Simmons (incumbent) | 121,158 | 50% | ||
| Democratic gain from Republican | Swing | ||||
| Turnout | 242,413 | 100% | |||
2008
| Party | Candidate | Votes | % | ±% | |
|---|---|---|---|---|---|
| Democratic | Joe Courtney (incumbent) | 212,411 | 66% | ||
| Republican | Sean Sullivan | 104,469 | 32% | ||
| Green | G. Scott Deshefy | 6,287 | 2% | ||
| Democratic hold | Swing | ||||
| Turnout | 323,167 | 100% | |||
2010
| Party | Candidate | Votes | % | ±% | |
|---|---|---|---|---|---|
| Democratic | Joe Courtney (incumbent) | 147,748 | 60% | ||
| Republican | Janet Peckinpaugh | 95,671 | 39% | ||
| Green | G. Scott Deshefy | 3,344 | 1% | ||
| Democratic hold | Swing | ||||
| Turnout | 246,763 | 100% | |||
2012
| Party | Candidate | Votes | % | ±% | |
|---|---|---|---|---|---|
| Democratic | Joe Courtney (incumbent) | 204,691 | 68% | ||
| Republican | Paul Formica | 87,828 | 29% | ||
| Green | Colin Bennett | 3,269 | 2% | ||
| Libertarian | Daniel Reale | 3,504 | 1% | ||
| Democratic hold | Swing | ||||
| Turnout | 299,652 | 100% | |||
2014
| Party | Candidate | Votes | % | ±% | |
|---|---|---|---|---|---|
| Democratic | Joe Courtney (incumbent) | 141,948 | 62% | ||
| Republican | Lori Hopkins-Cavanagh | 80,837 | 36% | ||
| Green | William Clyde | 2,602 | 1% | ||
| Libertarian | Daniel Reale | 2,549 | 1% | ||
| Democratic hold | Swing | ||||
| Turnout | 227,936 | 100% | |||
2016
| Party | Candidate | Votes | % | ±% | |
|---|---|---|---|---|---|
| Democratic | Joe Courtney (incumbent) | 207,584 | 63% | ||
| Republican | Daria Novak | 111,587 | 34% | ||
| Green | Jonathan Pelto | 5,332 | 2% | ||
| Libertarian | Daniel Reale | 5,016 | 1% | ||
| Democratic hold | Swing | ||||
| Turnout | 329,519 | 100% | |||
2018
| Party | Candidate | Votes | % | ±% | |
|---|---|---|---|---|---|
| Democratic | Joe Courtney (incumbent) | 179,731 | 62% | ||
| Republican | Dan Postemski | 102,483 | 35% | ||
| Green | Michelle Louise Bicking | 3,595 | 1% | ||
| Libertarian | Dan Reale | 3,305 | 1% | ||
| Democratic hold | Swing | ||||
| Turnout | 289,114 | 100% | |||
2020
| Party | Candidate | Votes | % | ±% | |
|---|---|---|---|---|---|
| Democratic | Joe Courtney (incumbent) | 217,982 | 59.37% | ||
| Republican | Justin Anderson | 140,340 | 38.2% | ||
| Green | Cassandra Martineau | 4,949 | 1.35% | ||
| Libertarian | Dan Reale | 3,901 | 1.06% | ||
| Democratic hold | Swing | ||||
| Turnout | 367,181 | 100% | |||
2022
| Party | Candidate | Votes | % | ±% | |
|---|---|---|---|---|---|
| Democratic | Joe Courtney (incumbent) | 165,946 | 58.2 | ||
| Republican | Mike France | 114,506 | 40.2 | ||
| Green | Kevin Blacker | 2,439 | 0.9 | ||
| Libertarian | William Hall | 2,140 | 0.7 | ||
| Total votes | 285,031 | 100.0 | |||
| Democratic hold | |||||
List of members representing the district
District organized from Connecticut's at-large congressional district in 1837.


.jpg.webp)
.jpg.webp)
.jpg.webp)
.jpg.webp)
.jpg.webp)
.jpg.webp)
.jpg.webp)
.jpg.webp)
.jpg.webp)


.tif.png.webp)
References
- ↑ "My Congressional District".
- 1 2 "2022 Cook PVI: District Map and List". Cook Political Report. Retrieved January 10, 2023.
- ↑ "Registration and Party Enrollment Statistics as of October 31, 2023" (PDF). Connecticut Secretary of State. Retrieved December 13, 2023.
- ↑ "Archived copy" (PDF). Archived from the original (PDF) on December 16, 2006. Retrieved December 4, 2006.
{{cite web}}: CS1 maint: archived copy as title (link) 2006 Official Election Results
- Martis, Kenneth C. (1989). The Historical Atlas of Political Parties in the United States Congress. New York: Macmillan Publishing Company.
- Martis, Kenneth C. (1982). The Historical Atlas of United States Congressional Districts. New York: Macmillan Publishing Company.
- Congressional Biographical Directory of the United States 1774–present
This article is issued from Wikipedia. The text is licensed under Creative Commons - Attribution - Sharealike. Additional terms may apply for the media files.