| |||||||||||||||||||||||||||||
| |||||||||||||||||||||||||||||
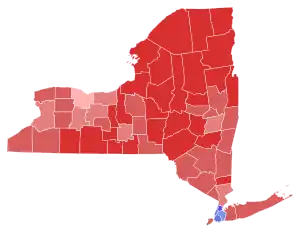 County results Pataki: 40–50% 50–60% 60–70% 70–80% Vallone: 50–60% 60–70% 70–80% | |||||||||||||||||||||||||||||
| |||||||||||||||||||||||||||||
.jpg.webp)

.JPG.webp)
| Elections in New York State |
|---|
 |
The 1998 New York gubernatorial election was an election for the state governorship held on November 3, 1998. Incumbent Republican governor George Pataki was re-elected with 54% of the vote.[1] This remains the last statewide election in New York where a Republican won a majority of the vote.
Democratic primary
Candidates
- Peter Vallone Sr., Speaker of the New York City Council
- Betsy McCaughey Ross, Incumbent Lieutenant Governor
- Charles J. Hynes, Former New York City Fire Commissioner and Incumbent District Attorney for Kings County
- James LaRocca
Polling
| Source | Date | Charles Hynes | Richard Kahan | James LaRocca | Betsy McCaughey Ross | Sheldon Silver | Peter Vallone |
|---|---|---|---|---|---|---|---|
| Quinnipiac | September 24, 1997 | 13% | - | 4% | - | 22% | 20% |
| Quinnipiac | December 10, 1997 | 13% | 1% | 3% | 26% | - | 17% |
| Quinnipiac | February 25, 1998 | 12% | 1% | 4% | 18% | - | 17% |
| Quinnipiac | March 25, 1998 | 16% | 1% | 3% | 27% | - | 16% |
| Quinnipiac | June 17, 1998 | 14% | - | 5% | 27% | - | 23% |
| Quinnipiac | July 15, 1998 | 11% | - | 3% | 13% | - | 35% |
Statewide results
| Party | Candidate | Votes | % | ±% | |
|---|---|---|---|---|---|
| Democratic | Peter Vallone Sr. | 416,147 | 56.38% | ||
| Democratic | Betsy McCaughey Ross | 156,592 | 21.22% | ||
| Democratic | Charles Hynes | 109,333 | 14.81% | ||
| Democratic | James LaRocca | 56,011 | 7.59% | ||
| Blank – Void – Scattering | N/A | ||||
| Majority | 259,555 | 35.17% | |||
| Turnout | 738,083 | 15.30% | |||
General election
Polling
| Source | Date | George Pataki (R) | Charles Hynes (D) | Betsy McCaughey Ross (Lib) |
|---|---|---|---|---|
| Quinnipiac | July 22, 1997 | 47% | 30% | - |
| Quinnipiac | September 24, 1997 | 55% | 26% | - |
| Quinnipiac | December 10, 1997 | 54% | 28% | - |
| Quinnipiac | February 25, 1998 | 60% | 23% | - |
| Quinnipiac | March 25, 1998 | 60% | 25% | - |
| Quinnipiac | June 17, 1998 | 59% | 18% | 12% |
| Source | Date | George Pataki (R) | Richard Kahan (D) |
|---|---|---|---|
| Quinnipiac | December 10, 1997 | 57% | 21% |
| Quinnipiac | February 25, 1998 | 62% | 17% |
| Quinnipiac | March 25, 1998 | 62% | 19% |
| Source | Date | George Pataki (R) | James LaRocca (D) | Betsy McCaughey Ross (Lib) |
|---|---|---|---|---|
| Quinnipiac | July 22, 1997 | 48% | 23% | - |
| Quinnipiac | September 24, 1997 | 55% | 21% | - |
| Quinnipiac | December 10, 1997 | 57% | 21% | - |
| Quinnipiac | February 25, 1998 | 61% | 18% | - |
| Quinnipiac | March 25, 1998 | 63% | 19% | - |
| Quinnipiac | June 17, 1998 | 59% | 15% | 13% |
| Source | Date | George Pataki (R) | Betsy McCaughey Ross (D) |
|---|---|---|---|
| Quinnipiac | December 10, 1997 | 54% | 29% |
| Quinnipiac | February 25, 1998 | 59% | 26% |
| Quinnipiac | March 25, 1998 | 57% | 30% |
| Quinnipiac | June 17, 1998 | 63% | 26% |
| Source | Date | George Pataki (R) | Sheldon Silver (D) |
|---|---|---|---|
| Quinnipiac | September 24, 1997 | 55% | 29% |
| Source | Date | George Pataki (R) | Peter Vallone (D) | Betsy McCaughey Ross (Lib) | Thomas Golisano (I) |
|---|---|---|---|---|---|
| Quinnipiac | July 22, 1997 | 47% | 27% | - | - |
| Quinnipiac | September 24, 1997 | 55% | 26% | - | - |
| Quinnipiac | December 10, 1997 | 56% | 26% | - | - |
| Quinnipiac | February 25, 1998 | 60% | 23% | - | - |
| Quinnipiac | March 25, 1998 | 58% | 26% | - | - |
| Quinnipiac | June 17, 1998 | 59% | 19% | 12% | - |
| Quinnipiac | September 27, 1998 | 53% | 26% | 4% | 9% |
| Quinnipiac | October 15, 1998 | 54% | 25% | 4% | 9% |
| Quinnipiac | October 28, 1998 | 57% | 24% | 3% | 10% |
| Quinnipiac | November 2, 1998 | 55% | 26% | 2% | 11% |
Results
| Party | Candidate | Votes | % | ±% | |
|---|---|---|---|---|---|
| Republican | George Pataki | 2,223,264 | 44.59% | ||
| Conservative | George Pataki | 348,727 | 6.99% | ||
| Total | George Pataki (incumbent) | 2,571,991 | 54.32% | +5.53% | |
| Democratic | Peter Vallone, Sr. | 1,518,992 | 30.47% | ||
| Working Families | Peter Vallone, Sr. | 51,325 | 1.03% | ||
| Total | Peter Vallone, Sr. | 1,570,317 | 33.16% | -12.29% | |
| Independence | Tom Golisano | 364,056 | 7.69% | +3.51% | |
| Liberal | Betsy McCaughey | 77,915 | 1.65% | -0.12% | |
| Right to Life | Michael Reynolds | 56,683 | 1.20% | -0.10% | |
| Green | Al Lewis | 52,533 | 1.11% | N/A | |
| Marijuana Reform | Thomas K. Leighton | 24,788 | 0.52% | N/A | |
| Unity | Mary Alice France | 9,692 | 0.21% | N/A | |
| Libertarian | Chris Garvey | 4,722 | 0.11% | -0.07% | |
| Socialist Workers | Al Duncan | 2,539 | 0.05% | +0.01% | |
| Blank – Void – Scattering | 250,696 | 5.02% | N/A | ||
| Majority | 1,001,674 | 21.15% | +17.81% | ||
| Turnout | 4,985,932 | ||||
| Republican hold | Swing | ||||
See also
References
This article is issued from Wikipedia. The text is licensed under Creative Commons - Attribution - Sharealike. Additional terms may apply for the media files.