< Page:Calculus Made Easy.pdf
This page has been proofread, but needs to be validated.
28
Calculus Made Easy
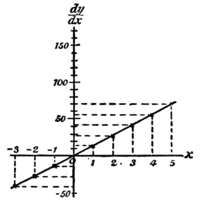
Let us illustrate this example by working out the graphs of the equations and , by assigning to a set of successive values, etc., and finding the corresponding values of and of .


These values we tabulate as follows:


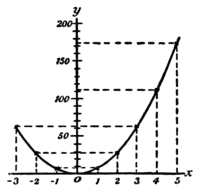 |  |
| Fig. 6.—Graph of . |
Fig. 6a.—Graph of . |
Now plot these values to some convenient scale, and we obtain the two curves, Fig. 6 and 6a.
This article is issued from Wikisource. The text is licensed under Creative Commons - Attribution - Sharealike. Additional terms may apply for the media files.