< Page:Life Movements in Plants.djvu
This page has been proofread, but needs to be validated.
DIURNAL VARIATION OF EXCITABILITY
67
relation between the hours of the day and the excitability as gauged by the amplitude of response (Fig. 28). It will
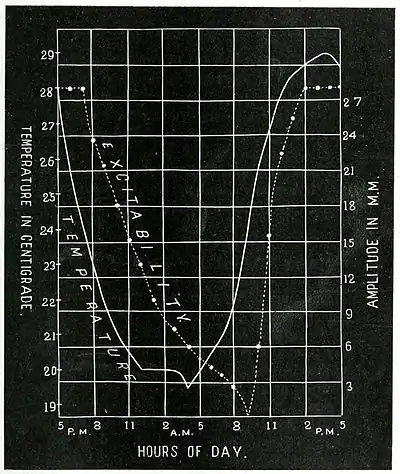
Fig. 28. The continuous curve shows the relation between the hour of the day and temperature. The dotted curve exhibits relation between the hour of the day and excitability.
be seen that there is, broadly speaking, a marked resemblance between the two curves, which demonstrate the
This article is issued from Wikisource. The text is licensed under Creative Commons - Attribution - Sharealike. Additional terms may apply for the media files.