< Page:Light waves and their uses.djvu
This page has been validated.
Interference Methods in Spectroscopy
71
two components of each line. The conclusion which can be drawn from observation of such a curve as this is that the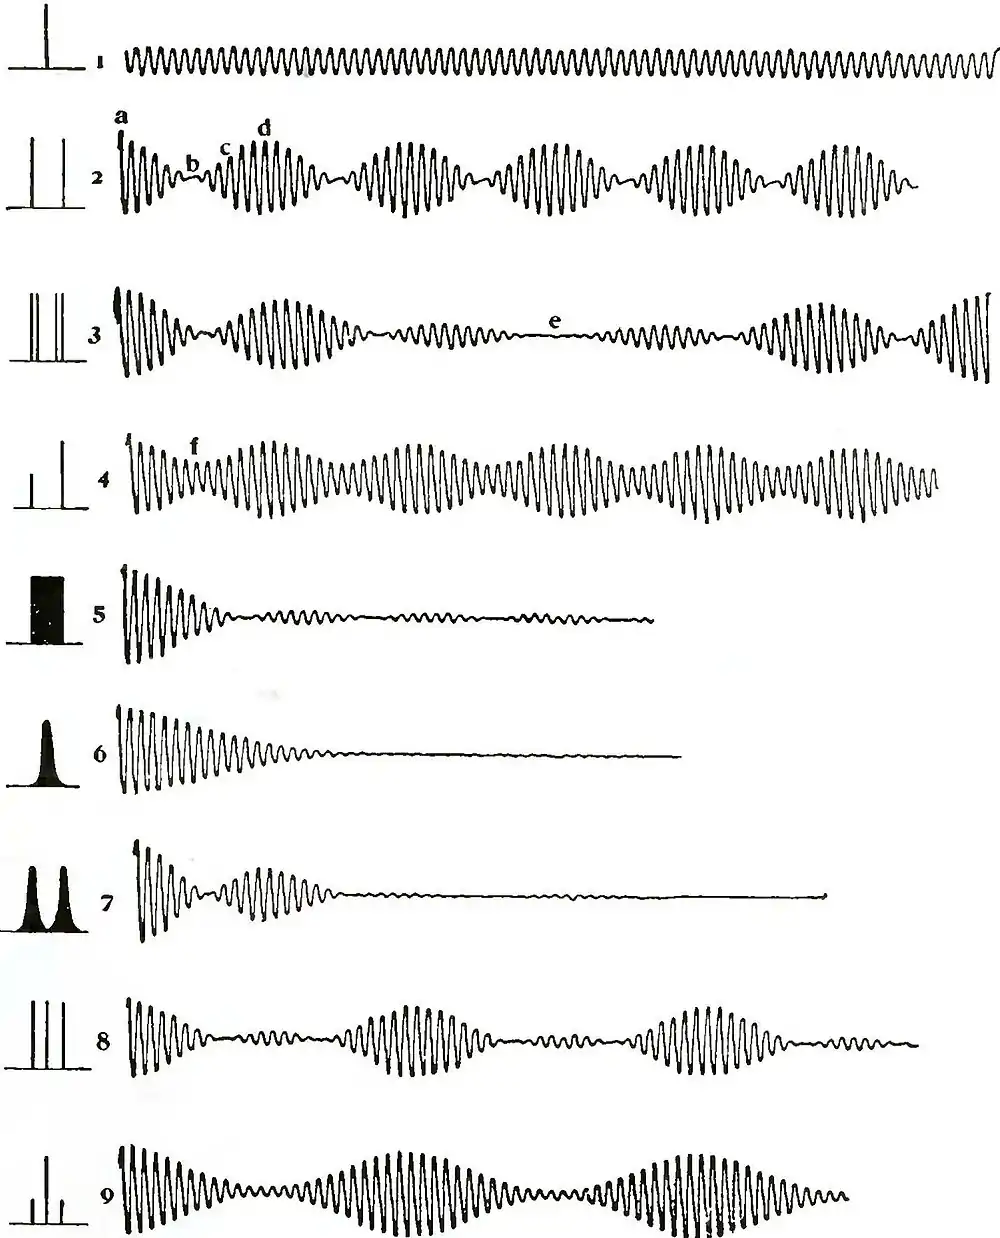 FIG. 58 source which was used in obtaining it was a double line, each of whose components was double.
Curve 4 represents the visibility curve of two lines, one of which is very much brighter than the other, but whose
This article is issued from Wikisource. The text is licensed under Creative Commons - Attribution - Sharealike. Additional terms may apply for the media files.