| ||||||||||||||||||||||||||||
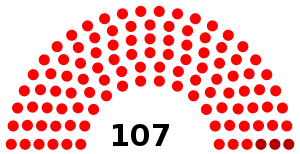
All 107 seats in the National Assembly 54 seats needed for a majority | ||||||||||||||||||||||||||||
|---|---|---|---|---|---|---|---|---|---|---|---|---|---|---|---|---|---|---|---|---|---|---|---|---|---|---|---|---|
| ||||||||||||||||||||||||||||


 |
|---|
|
|
Parliamentary elections were held in Madagascar on 6 September 1970. The result was a victory for the ruling Social Democratic Party, which won 104 of the 107 seats in the National Assembly. Voter turnout was 95%.[1]
Results
 | |||||
|---|---|---|---|---|---|
| Party | Votes | % | Seats | +/– | |
| Social Democratic Party | 2,413,421 | 92.77 | 104 | 0 | |
| Congress Party for the Independence of Madagascar | 186,626 | 7.17 | 3 | 0 | |
| Others | 1,381 | 0.05 | 0 | 0 | |
| Total | 2,601,428 | 100.00 | 107 | 0 | |
| Valid votes | 2,601,428 | 99.56 | |||
| Invalid/blank votes | 11,528 | 0.44 | |||
| Total votes | 2,612,956 | 100.00 | |||
| Registered voters/turnout | 2,756,978 | 94.78 | |||
| Source: EISA | |||||
References
| Presidential elections | |
|---|---|
| Parliamentary elections | |
| Local elections |
|
| French elections |
|
| Referendums | |
This article is issued from Wikipedia. The text is licensed under Creative Commons - Attribution - Sharealike. Additional terms may apply for the media files.